You should probably follow the discussion below while running the system; you can do that in one of two ways. You can download the system and run it as an application, or you can follow the examples inside your browser by running the JavaBayes applet. In the applet, you can use the full functionality of the system except that you have to comply with your browser's policy concerning applets. Running as an applet, JavaBayes does not let you perform load/save operations in the local file system.
|
|
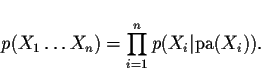
More mathematically, a Bayesian network is composed of a directed acyclic graph and a collection of conditional probability distributions. Every node of the graph is associated with a variable Xi. The arcs in the graph indicate the collection of parents of any variable. For a variable Xi, denote the parents of Xi by pa(Xi). Every node is also associated with a conditional probability distribution: the probability of the variable Xi conditional on its parents pa(Xi). This probability is denoted by p(Xi|pa(Xi)); for discrete variables this probability is represented by a table.
The graphical and probabilistic structure of a Bayesian network
represents a single joint probability distribution. This
distribution is obtained as follows:
JavaBayes can load networks in different formats: the BIF format 0.1, the BIF format 0.15, the XMLBIF format 0.2 and the XMLBIF format 0.3. JavaBayes can also save networks in different formats: the BIF format 0.15, the XMLBIF format 0.3, and the BUGS format. The idea is that the BIF format 0.15 supercedes the BIF format 0.1, so there is no need to save anything in version 0.1. On the other hand, XMLBIF format 0.2 is a bit experimental (based on XML), and quite different from 0.15, so both BIF 0.15 and XMLBIF 0.3 are fully supported right now. The BUGS format is described in the documentation of the BUGS system, a complete interface and engine for Bayesian inferences through Gibbs sampling. The BUGS system offers the most general approach to the calculation of posterior probability values in probabilistic models; it can be used to process arbitrary networks generated in JavaBayes.
Once a network is loaded into JavaBayes, its graph is displayed in the editor window. After you work with the network, you can clear the current network in the editor, going to the File menu and choosing the Clear option. Note that if you load a network, any network that was loaded is cleared.
You can obtain information about the network and its variables using the Edit modes in the editor window. There are two types of interaction in JavaBayes: interaction with the editor window and interaction with the console window. The operations described above (opening, saving, clearing, etc) are all controlled by menus in the console window. Options in the console window handle files and control the overall behavior of the system. On the other hand, the editor window controls operations that focus on the creation and manipulation of a Bayesian network in the system. These operations are controlled by buttons on the top and bottom of the editor window.
In several modes, you can use the mouse to draw a rectangular area around a number of nodes. To do that, click on a point that is not inside a node, and then drag the mouse. The nodes inside this rectangular area form a group; they can be moved and deleted together.
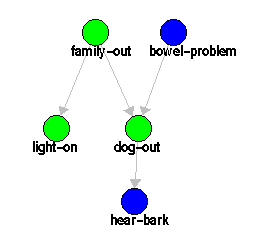
Note that the button Edit Network does not represent a mode, because it does not change the meaning of operations in the editor drawing area. The Edit Network button simply calls a dialog window that allows you to edit the characteristics of the network. Try the Edit Network with the DogProblem network. You have the option of changing the name of the network, inserting or modifying properties of the network. You can also specify global neighborhoods for the network (see the discussion of robustness analysis.
The Edit Variable and Edit Function activate different modes in the editor window. In the Edit Variable mode, any mouse click over a node produces a dialog that allows you to edit the characteristics of the node. In the Edit Function mode, any mouse click over a node produces a dialog that allows you to edit the probability function associated to the node variable.
Try editing the contents of some nodes in the DogProblem network. Start with the Edit Variable mode. A dialog appears when you click in a node. This dialog allows you to edit the name of the variable, the properties of the variable, the properties of the probability distribution associated with the node, and select the type of variable and the type of distribution associated with the node:
After you familiarize yourself with the Edit Variable dialog, try editing the probability values that are associated with every variable in the network. There are two ways to edit probability values.
First, you can switch the editor window to Edit Function mode; in this mode, you obtain a dialog for the probability values of any node that gets a mouse click. When you are reading the tables that display conditional distributions, note that the parents are always laid in the horizontal; make sure you understand the meaning of the entries before entering values.
The second way to visualize or edit the probability values is to swith the editor window to Edit Variable, click on a node, and then click on the Edit Function button in the Edit Variable dialog.
Note an important point concerning the editing dialogs. When you edit aspects of the network in the editing dialogs, the changes do not affect the network until you press the Apply button. If you dismiss the dialog, the changes are lost. Changes are effective after you press Apply (and cannot be undone after that); after you press Apply, you can dismiss the dialog and the changes are retained.
Note the following: in the Edit Variable dialog, there is a button that calls the Edit Function dialog. Changes in the type of the variable are only effective after you press Apply; only changing the type of the variable and calling the Edit Function dialog will generate an Edit Function dialog that follows the currently applied type.
Once in Create mode, click on any point not occupied by a node, and a node will appear. Nodes receive default names and are associated to default (uniform) distributions when they are created; you have to use the Edit Variable and Edit Function dialogs to edit them. If you click on a node and drag the mouse, an arrow will be created, stemming from the node where you first clicked. If you drag the mouse until a second node, an arc will be created between the nodes. The second node is a child of the first node; the first node is a parent of the second node. The system does not allow you to create cyclic structures, nor it allows you to create an arrow to a node from itself.
You can delete nodes and arcs in Delete mode. To delete a node or an arc, just click on it. If a group of nodes has been created, then clicking on any node in the group causes the whole group to be deleted.
You can mode nodes in Move node. To move a node, just click on it and drag it. You cannot move arcs, as the position of an arc is solely defined by the position of the nodes the arc is associating. If a group of nodes has been created, then clicking and draggin any node in the group causes the whole group to be moved.
Suppose you want to calculate posterior probabilities for some variables in the DogProblem network. For example, you can calculate p(l | h, bc), the posterior probability of l given h and bc (light-on given hear-bark and not bowel-problem). The Artificial Intelligence community usually calls this the "belief" in l given the "evidence" h and bc. Obtaining the belief given the evidence is usually called "belief updating". To do that, you have to set hear-bark as true and bowel-problem as false; that's the evidence.
Variables are set when the editor window is in Observe mode. To set variables for a variable, click on the variable. A dialog will appear, giving you the opportunity to insert observations. If you want to indicate that a variable was observed, click on the observed value. If you want to indicate that a variable was not observed, then make sure the checkbox on the top of the dialog indicates no observation. Note that if you use the checkbox to indicate that an observation was made (without actually clicking on any specific value), the system will automatically take the first value in the list as the observed value.
After you insert the evidence, you can query the variable light-on by switching the editor window to Query mode. Click the mouse on the variable light-on; JavaBayes produces:
Posterior distribution:
probability ( "light-on" ) {//1 variable(s) and 2 values
        table 0.236519 0.763481 ;
}
JavaBayes allows you to calculate several probabilistic quantities involved in problems like this. There are essentially four types of calculations that are possible in JavaBayes. You can query any variable for its posterior probability distribution. Or you can query any variable for its posterior expectation. A query is obtained by clicking on the variable of interest. Alternatively, you may obtain explanation for a set of variables or for all variables in the network. An explanation is a configuration of variables that maximizes the probability of the evidence; you get an explanation by clicking on any variable.
Regarding expectations, JavaBayes handles only univariate utility functions; a particular case is the expected value for a variable, and this is what you can obtain in the graphical interface. Suppose you declare a variable like this:
variable  "LowLLapse" { //4 values
    type discrete[4] {  "CloseToDryAd"  "Steep"  "ModerateOrLe"  "Stable" };
    property "position = (857, 440)" ;
}
In this case, the expectation is calculated
assuming the following values:
| CloseToDryAd | 0 |
| Steep | 1 |
| ModerateOrLe | 2 |
| Stable | 3 |
variable  "LowLLapse" { //4 values
    type discrete[4] {  "-4.20"  "1.0"  "14.22"  "100.0" };
    property "position = (857, 440)" ;
}
To obtain an explanation, JavaBayes finds the
configuration for a set of ``explanatory'' variables
such that the posterior probability of the evidence is maximized.
Maximization of probabilities is usually called
maximum a posteriori estimation; a particular case
that has received great attention in the literature is the
most probable explanation problem (called MPE),
where all variables are explanatory variables. JavaBayes
lets the user choose which one of these two problems is to
be solved. If the user wants to estimate some variables,
then the user must indicate which variables are explanatory
in the Edit Variable dialog.
The console area does not scroll indefinitely; the size of the scrolling buffer is controlled by the Java distribution you have, not by JavaBayes. Because Java displays only a limited number of lines, information may be lost (and note that the maximum number of lines that is actually displayed is not accessible by the program). To clear the text in the JavaBayes console and send the contents of the console to a file, try the Dump console option in the File menu. This option asks for a filename, dumps all the contents of the console window into the indicated file, and clears the console window. This option is also appropriate if you are interested in logging your actions or inferences during a JavaBayes session.
The Alarm network is well-known as it is relatively old and has been used in a large number of studies about inferences and about learning. The network was created to model situations that arise in medicine [5]; it contains lots of symptons, illnesses, exams, and other medical terms. Even though you can experiment with all example networks, the Alarm network is particularly nice as it is relatively large, but not too much; it is relatively sparse, but not too much; and it is based on real situations that have real meaning.
First, go to the File menu and pick the Open item. Now select the file containing the Alarm network; you will see the network appear in the editor window. If you have a large computer screen, you may be able to see the entire network; if you cannot see the entire network in a single screen, you have to use the scrollbars to view the network in pieces.
Try inserting some evidence randomly in the network, and then query some variables (first use the Observe mode, then swith to Query mode). You will realize that inference with the Alarm network is slower than inference with the DogProblem network, but not substantially so. JavaBayes starts any query by selecting only those variables that are necessary for the calculation of posterior probabilities; in a relatively sparse network like the Alarm network, it is usually the case that only a fraction of the network is used in any given query.
Try different inference algorithms, and check if you can feel the difference in speed. In actually, both algorithms process single inferences quickly, so it is almost impossible to feel any difference between them.
To familiarize yourself with the network, check the Edit network, Edit variable and Edit function dialogs, and select some variables as explanatory. Then query the network for posterior probabilities, posterior expectations, best explanation for the complete network and best explanation for the explanatory variables. See if you can grasp the meaning of explanations. Note that nodes turn orange when they are used as explanatory variables. So if you ask for a complete explanation, all nodes (except evidence nodes) turn orange. And if you ask for an explanation only for explanatory variables, then only the explanatory variables turn orange.
Try viewing the network and the buckets in the console window, by setting the corresponding options in the Options menu. After a few inferences, the console window will be full; try dumping its contents into a file.
At this point, you probably have understood almost everything in JavaBayes, and you are ready to use the system for your own networks.